Erie County Households & Families
Analysis Categories
Household size, familial status, and marital status by ZIP code.
A household's makeup can say a lot about that geographic area's composite population and be an important factor is where people choose to live or not. Familial and marital status both assist in describing that area's attraction to a younger population, whereas household size can be an indicator of shared living quarters for non-family housemates. Overall housing density is another indicator of amenities or consumer establishments.
Household Size
Erie County trends higher on two-person households, followed by one-person households; these two categories constitute 65.6% of all households in the county. Looking at county-wide housing densities, the only three ZIP codes which feature household densities over 10,000 are 16506, 16509, and 16510.
Familial Status
The majority of ZIP codes feature a higher percentage of family versus non-family households, with the exception of downtown Erie ZIPs 16501, 16502, and 16507 in which non-family households are the majority.
Marital Status
Married-Couple households (56,334) far outweigh both Female and Male single households combined (10,924).
Over Time
Despite the population decrease experienced by Erie County as a whole, the overall number of households increased over the analysis time period. Since 2009, households have decreased by +1,382 to a total of 68,493, a -2.0% fall.
EVS analyzes the data in each topic category using indicators, which report a targeted and digestible number, rate, or amount to represent Erie County as a whole. While this does not cover every aspect of the topic, it assists in establishing Erie's performance relative to the prior year(s). The indicators for the Demographics: Households topic are:
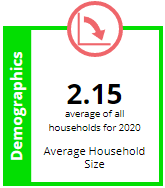
This indicator measures the the average number of people in individual households in a geographic area, including family members, non-family members and children. The trend for Average Household Size was down and worse in 2019, with a reported decrease of -0.03 within the County.This rate drops Erie County further from the Pennsylvania state average household size of 2.20.
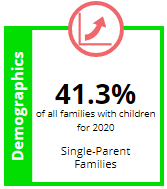
This indicator measures the percentage of single-parent families with children, as a percent of all families with children under 18. The trend for Single Parent Families was up and worse in 2019 with a reported increase of +0.9% within the County.
Data from the U.S. Census ACS as of 12/2021.