Poverty
Analysis Categories
Poverty by Age Range, Sex, Employment Status, Race/Ethnicity, and Educational Attainment, by Census Tract.
The percentage of people living in or near poverty is a measure of the overall economic health of a region. It also indicates the level of need for social and government supports.
Race
For populations of color, poverty remains highest for Black/African Americans (25.3%) and those whom identified as Two or More Races (23.4%), as compared to White (14.6%) citizens. While Erie County's White populations are the lowest of the demographic groups, compared to the PA equivalent population at 12.4% in 2019, it is still high.
Age
Poverty by age group followed a stepped decrease as the population ages. All age groups in Erie County are at a higher poverty rate than their statewide counterparts. The highest disparity occurs within the population aged 5 years and younger, where in Erie County the poverty rate is 29.5% compared to 19.2% statewide.
Educational Attainment
Poverty by educational attainment in Erie County closely matches trends in the U.S. for the demographics with less than high school educations, with a steady decline in afflicted populations with increasing educations. Comparatively, nearly a third of Erie's population without a high school diploma or equivalent fall below the poverty level (32.6%), statewide only 24.4%.
Over Time
Poverty in Erie County incrementally rose from 2010 to 2013 and remained at an average of 16.7% over the last 5 years, but has fallen since 2018 to 16.0%. The Erie County average has remained higher than PA statewide poverty rate of 12.4%.
EVS analyzes the data in each topic category using indicators, which report a targeted and digestible number, rate, or amount to represent Erie County as a whole. While this does not cover every aspect of the topic, it assists in establishing Erie's performance relative to the prior year(s). The indicator for the Economy: Poverty topic is:
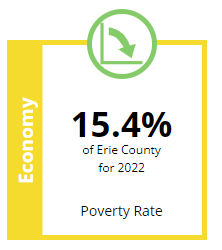
This indicator measures the percentage of the entire population of Erie County which fall below the poverty level for the latest data year. The indicattor trend for Poverty Rate is down and better from 2021 to 2022, with a reported decrease of -0.3% within the County. There were an estimated 39,662 individuals living in poverty in Erie County in 2022.
Data from the U.S. Census ACS as of 03/2024. Population 25 years and older used for Education category.