Voter Participation
Analysis Categories
Voter Elligibility, Registration, and Participation rates in Presidential, Municipal, and General elections since 2000. Additionally shows Party Registration by House, Senate, and Congressional districts.
This analyzes how many people are potentially able to vote, a basic right of all citizens. Changes in size of the voting-age population can affect the dynamics of local elections. Registration and Participation indicates the citizenry's interest, commitment and belief in the value of participating in our political process.
The participation rates among voters depends on the type of election, with highest participation in Presidential elections (67%), less in General (45%), and lowest in Municipal (29%) since 2000. Party registration shows a higher number of registered Democrats. Overall, registration is trending positively, with a higher percentage of eligible voters registered in 2019 (89.6%) than any year since 2009 (90.5%).
EVS analyzes the data in each topic category using indicators, which report a targeted and digestible number, rate, or amount to represent Erie County as a whole. While this does not cover every aspect of the topic, it assists in establishing Erie's performance relative to the prior year(s). The indicators for the Community: Voter Participation topic are:
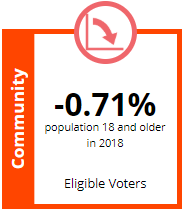
This indicator measures the change in voter-age population in Erie County. The trend for Eligible Voters is down and worse from 2017 to 2018, with a reported decrease of -0.71% within the County, representing -1,524 individuals.
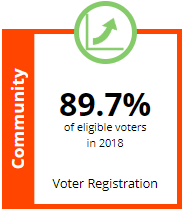
This indicator measures the percentage of elligible voters who have registered to vote for latest election. The trend for Voter Registration is up and better from 2017 to 2018, with a reported increase of +1.2% within the County. While the trend of voter registration increasing is positive for Erie County, it can not be entirely attributed to increased civic engagement, as the decline in Erie's younger population can also affect this rate.
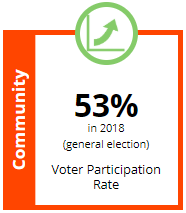
This indicator measures the percentage of participatory voters compared to total elligible voters in Erie County for latest election. The trend for Voter Particpation is up and better from 2017 to 2018, with a reported increase of +53.0% within the County. This can be explained from the election cycle, with 2018 being a generalelection year following the 2017 municipal election, however 2018's general election participation rate was 40.3% higher than the last general election in 2015, represting a difference of 29,207 voters.
Data from PA Department of State as of 12/2020.