Erie County Household Income
Analysis Categories
Median Income by type of worker, educational attainment, by Census Tract. Total Workers and Income Ranges by Census Tract.
Median household income is a gauge of the overall economic health of the region and the financial resources of households.
Family Types
Median household incomes are highest in married-couple families ($58,434) as compared to single male and single female householders. A large median household income gap exists between single male ($38,308) and single female ($28,166) householders, with a difference of $10,142 or 26.5%.
Income Ranges Householder Race
Black/African American ($25,302) and Some Other Race ($29,062) populations suffer the lowest median household incomes in Erie County. Asian householders experience higher on median household incomes with $63.321 countywide.
Family Size
While 2-person families comprise the largest segment of Erie county's family size breakdown, their median household income of $54,090 is the lowest among the 6 categories. The highest median household income occurs in the 4-person family segment at $80,787.
Over Time
Median household income overall has increased over the analysis time period. Since 2010, median income increased by +$8,073 to a total of $51,529, a +18.6% rise.
By Area
Median household incomes skew lower the closer to Erie City center, particularly in ZIP code 16501 ($10,874). This can partially be attributed to the density of university housing and low-income housing designated in these areas. The highest median household incomes occur farther West and East of the city limits, particularly in the 16415 ($96,556) and 16421 ($75,063) ZIP codes.
EVS analyzes the data in each topic category using indicators, which report a targeted and digestible number, rate, or amount to represent Erie County as a whole. While this does not cover every aspect of the topic, it assists in establishing Erie's performance relative to the prior year(s). The indicators for the Demographics: Income topic are: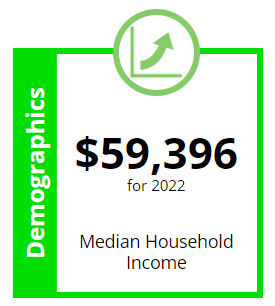
This indicator measures the median household income in dollars for all of Erie County in latest data year. The trend for Median Household Income was up and better in 2022, with a reported increase of +$3,447 within the County, representing +6.16%.
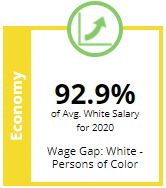
This indicator measures the wage and salary income of adults of color (aged 16-64) as a percent of wages and salary income of white adult (color includes all persons who are American Indian, Asian, black, or two or more races, or those who identify themselves as belonging to another race, as well as those who are Hispanic of any race). The trend for Wage Gap: White - Persons of Color was up and better in 2019 with a reported increase of +0.39% within the County. This indicates that on average for the total population, a person of color makes 92.9 cents on the dollar compared to their White peers.
Data from the U.S. Census ACS as of 04/2024.