Consumer Spending
Analysis Categories
Consumer spending by category, per household by Census Tract
Consumer spending across the included categories gives a perspective on the cost of living. Conducting the analysis at the Census Tract level provides further insight into the communities and disparities among the varying geographic areas present in the county.
Housing remains the highest cost for county residents, at a 32.41% yearly average of consumer dollars spent on 2022, up from 30.1% in 2020. In general, census tract spending per category followed the County averages. The lowest concentration of spending geographically occurs in downtown Erie, with average consumer spending at $18,386. Comparatively, the County average was $71,603.
EVS analyzes the data in each topic category using indicators, which report a targeted and digestible number, rate, or amount to represent Erie County as a whole. While this does not cover every aspect of the topic, it assists in establishing Erie's performance relative to the prior year(s). The indicators for the Economy: Spending topic are:
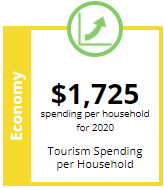
This indicator measures percent of consumer spending which all Erie County households spend per year on tourism (airfare, vehicle rental, lodging, food/drink, entertainment on trips) for latest data year. The trend for Tourism Spending is maintaining from 2019 to 2020. Tourism spending reflects 2.8% of Erie County average annual household spending.
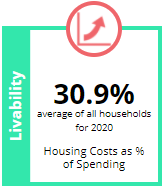
This indicator measures the percent of consumer spending which all Erie County residents spend per year on housing costs, for the latest data year. The trend for Housing Costs as a Percentage of Spending is up and worse from 2019 to 2020, with a reported increase of +0.4% within the County, representing an average of $17,359.
Data from the Census Business Builder: Regional Analyst Edition as of 12/2020. Spending information based on consumer expenditures per household.