Unemployment
Analysis Categories
Unemployment by Race/Ethnicity, Education, Sex, Age Range
Unemployment rates are a relatively timely indicator of current local economic conditions, particularly recent changes in the employment landscape that reflect the overall health of the economy. Throughout the nation, racial disparities across many indicators of well-being (including unemployment rates) are persistent, troubling and in need of attention.
Race
Unemployment for individuals identifying as Two or More Races (11.4%) is the highest among all racial groups, while unemployment among American Indian and Alaskan Native alone (1.4%) is the lowest. The highest concentration geographically falls within Census Tract 1, Census Tract 20 and Census Tract 18.
Age
In 2022, unemployment in Erie County remained higher for age groups 16 to 19 and 20 to 24. The rate for age group 75 years and over (4.5%) is higher than the U.S. (3.9%) which could represent a more difficult job market for new employees. Conversely, Erie County's 65- to 74-year-old unemployment rate of 2.5% is lower than the U.S. average of 4%.
Educational Attainment
EVS analyzes the data in each topic category using indicators, which report a targeted and digestible number, rate, or amount to represent Erie County as a whole. While this does not cover every aspect of the topic, it assists in establishing Erie's performance relative to the prior year(s). The indicator for the Economy: Unempoyment topic is:
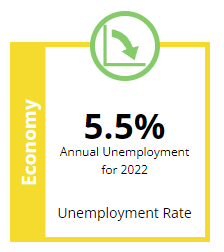
This indicator measures the unemployment rate for the latest data year across all sectors and demographics in Erie County, as a percentage. The indicator trend for Unemployment Rate was up in 2021, with a reported increase of .50% from 2020 within the County. The Unemployment rate has decreased by .40% in 2022.
Data from the U.S. Census ACS as of 03/2024. Population 20 to 64 years old used for Education, Race, and Sex categories.