Mortality Rates
Analysis Categories
Underlying cause of death by Cancer, Cardiovascular Diseases, Chronic Lower Respiratory Diseases, Drug-Induced, Heart Disease, and Suicide by race/ethnicity, age range, or sex. Banded in 3 year increments since 2002.
Death rates are a measure of the overall health of a community, particularly since some of the most common causes of death, such as heart disease, can be prevented or mitigated through lifestyle changes, prevention efforts, early intervention, and better access to quality health care.
Cancer
From 2012 to 2014, the age group 85 and older experienced the highest number of cancer-related deaths, followed by the age group 70 to 74, which recorded the second highest number of deaths from cancer. Generally, the percentage of cancer deaths is higher among males compared to females, with the exception of the periods 2002–2004 and 2014–2016, during which females had a higher percentage of cancer deaths.
Cardiovascular Disease
Since 2016, cardiovascular disease deaths in Erie County have been on the rise, particularly among individuals aged 80 and older, who continue to experience the highest rates. Additionally, the number of deaths due to major cardiovascular diseases has been steadily increasing over time for males.
Chronic Lower Respiratory Disease
Deaths from chronic lower respiratory diseases have shown a slight decline overall. Specifically, the number of deaths has decreased among individuals aged 65 to 84. Despite this decline, the highest number of deaths due to chronic lower respiratory diseases continues to be observed in the 85 and older age group. Racially, the pattern deviates from average of all causes of death, with White Erie County residents representing 95% of chronic lower respiratory deaths. Conversely, the Black population represents only 3.1% of chronic lower respiratory disease deaths from the average of all causes.
Drug-Induced
The total number of drug-induced deaths has increased and reached its highest level since 2012-2014, with 71% of these deaths occurring in the male population (2020-2022). Age ranges for drug induced deaths begin to spike at ages 25 to 44, but remain highest for ages 30 to 34.
Heart Disease
The overall count of deaths due to heart disease has increased since 2018-2020. Since 2012, the percentage of heart disease deaths among males has consistently been higher than that among females. Additionally, the age group most affected by heart disease remains those aged 85 and older, who experience the highest number of deaths due to this condition.
Suicide
Between 2020 and 2022, the age group 35 to 39 experienced the highest number of deaths due to suicide. The number of suicide deaths among males has consistently exceeded that among females. This trend has persisted for some time, highlighting a significant disparity in suicide rates between genders.
EVS analyzes the data in each topic category using indicators, which report a targeted and digestible number, rate, or amount to represent Erie County as a whole. While this does not cover every aspect of the topic, it assists in establishing Erie's performance relative to the prior year(s). The indicators for the Health: Mortality topic are:
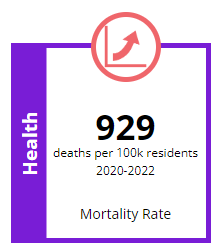
This indicator measures the number of deaths per year, expressed as an age-adjusted rate per 100,000 residents. The trend for Mortality Rate was up and worse for the latest 2020 to 2022 period with a reported increase of +100 deaths per 100,000 residents within the County. There were 829 deaths per 100,000 residents within the County in the year set 2018 to 2020.
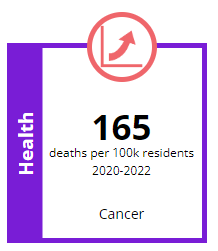
This indicator measures the number of deaths per year due to cancer, expressed as an age-adjusted rate per 100,000 residents. The trend for Cancer Mortality was up and worse for the latest 2020 to 2022 period with a reported increase of +5 deaths per 100,000 residents within the County. There were 160 cancer deaths per 100,000 residents within the County in the year set 2018 to 2020.
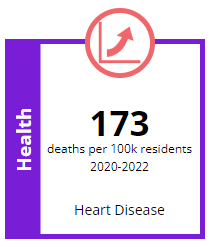
This indicator measures the number of deaths per year due to heart disease, expressed as an age-adjusted rate per 100,000 residents. The trend for Heart Disease Mortality was up and worse for the latest 2020 to 2022 period with a reported decrease of -8 deaths per 100,000 residents within the County. There were 165 heart disease deaths per 100,000 residents within the County in the year set 2018 to 2020.
These Data were provided by the Pennsylvania Department of Health. The Department specifically disclaims responsibility for any analyses, interpretations or conclusions. Updated as of 08/2024.