Population
Analysis Categories
Population demographics by age, race, and location by ZIP, yearly from 2001 to a projected 2025.
Population measures provide insight on how communities are changing in size and composition. The racial and ethnic makeup of a community can offer insight into its levels of diversity, which also may reflect particular challenges and opportunities. The age of a population can affect a community's character and the services that it requires.
Age
From 2001 to 2017 all age groups below 55 years old experienced population decline, whereas all age groups above 55 saw an increase. This trend is expected to adjust between 2019 to 2025, with 35 to 45 seeing an increase in population, and 45 to 65 declining.
Race
On the topic of race and ethnicity, between the years 2001 to 2019, the population of White Erie County residents was the only to fall, by -24,566 residents or nearly -10%. Conversely all other races saw an increase, with the highest being Hispanic (5747) and residents of Two or More races (3209). Between 2019 to 2025, Hispanic residents are estimated to continue increasing (by 1088).
Over Time
From 2001 to 2019 Erie County has experienced a population decline of -9,892 across all demographic categories, representing a -4% change. This gap is expected to increase by a further -2% (approximately -6,359 people) by 2025.
EVS analyzes the data in each topic category using indicators, which report a targeted and digestible number, rate, or amount to represent Erie County as a whole. While this does not cover every aspect of the topic, it assists in establishing Erie's performance relative to the prior year(s). The indicators for the Demographics: Population topic are:
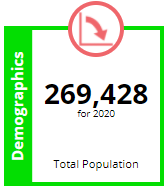
This indicator measures the total population for Erie County for the latest data year. The trend for Total Population was down and worse in 2020, with a reported decrease of -1,330 residents within the County, representing -0.5%. As explored in the Migration topic, the majority of the decrease in population occurred among the White residents of Erie County, at ages 0 to 29 and 40 to 59.
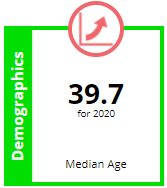
This indicator measures the median age for the entire epopulation of Erie County for the latest data year. The trend for Median Age was up and worse in 2019 with a reported increase of +0.3 years within the County. An aging population carries with it concerns including the decline in working-age population, an increase in health care costs, and all-around changes to the economy.
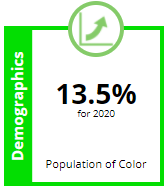
This indicator measures the percentage of the entire population of Erie County for tha latest data year which are Black, Hispanic, Asian, American/Alaskan native, Native Hawaiian/Pacific Islanders, or are of two-or-more races. The trend for Population of Color was up and better in 2019 with a reported increase of +.3% within the County. While the population of color has been increasing incrementally since 2000, the largest factor for the increased percentage of the population of color comes from the decrease of Erie County's White residents.
Analysis performed by the Data Center on data from Emsi, as of 12/2020.