Economy Indicators
Gauges of Erie's economic vitality as they pertain to community indicators presents the relationship which the population has with its money through salary, spending, poverty, and unemployment data.
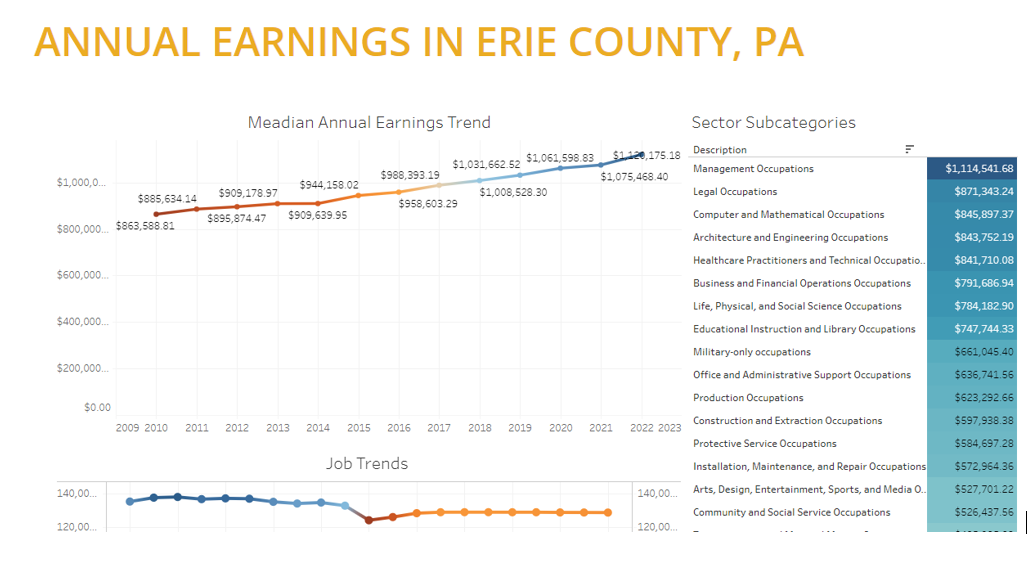
- Salaries are a gauge of overall economic health and a measure of the degree to which employees are sharing in the prosperity of a community. They also indicate the vitality of a region and its ability to compete and attract workers.
- Consumer spending across the included categories gives a perspective on the cost of living. Conducting the analysis at the census tract level provides further insight into the communities and disparities among the varying geographic areas present in the county.
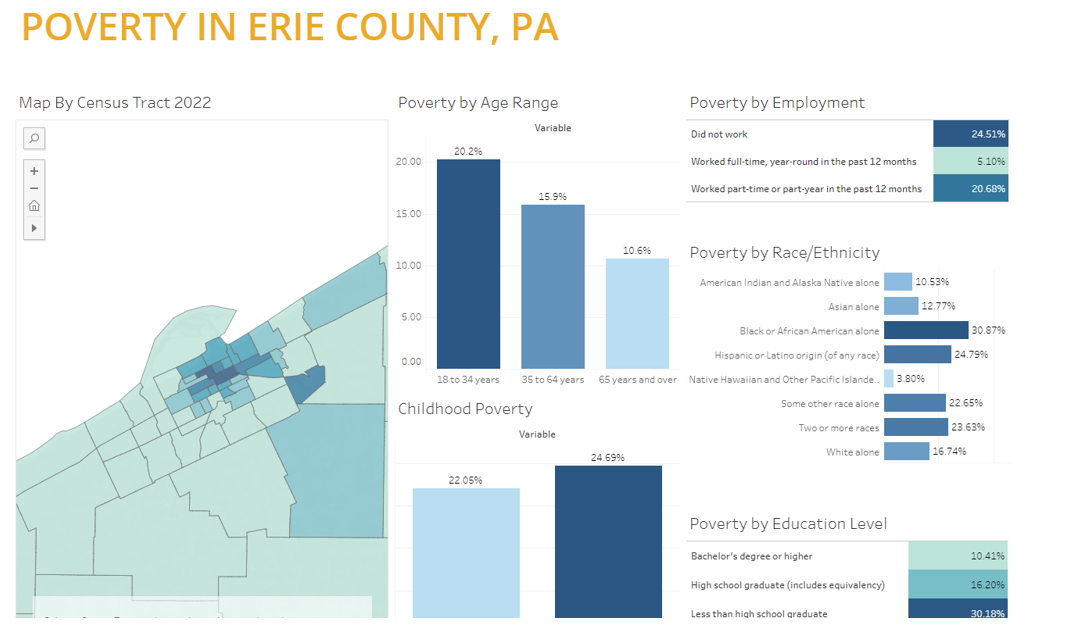
- The percentage of people living in or near poverty is a measure of the overall economic health of a region. It also indicates the level of need for social and government supports.
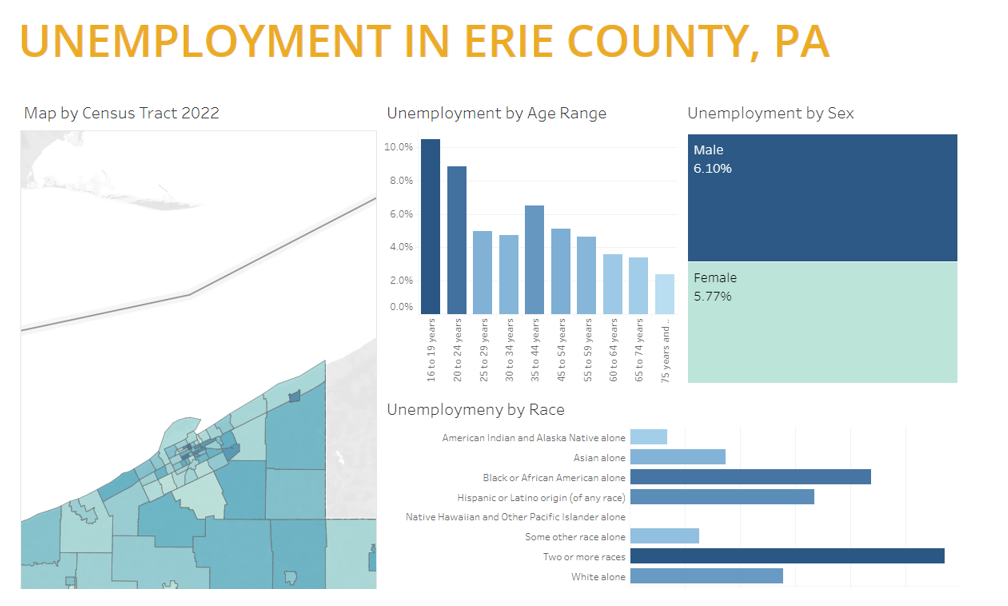
- Unemployment rates are a relatively timely indicator of current local economic conditions, particularly recent changes in the employment landscape that reflect the overall health of the economy. Throughout the nation, racial disparities across many indicators of well-being (including unemployment rates) are persistent, troubling and in need of attention.
Explore the Data in More Detail
Click on any of the previews below to access the topic pages for each data cetagory
Unemployment Insights Annual Earning Insights